
Boston Bruins
Bruins Season Primer by the Numbers

The puck drops on the Boston Bruins season on Thursday against the Dallas Stars. Finally some real hockey.
Here’s a look under the hood at the numbers that have made the Bruins a contender year over year recently. Below, using the VERSUS team comparison tool, we can compare last season (right side) versus the previous season 2017-18 on the left side.
There are only a handful of statistics here, however, they are presented in various playing conditions; 5 vs 5, power play, penalty kill, leading and trailing. Each ‘playing-condition’ section cascades from critical to more critical; Corsi (shot attempts) to ‘Scoring Chances’ to ‘High-Danger Chances’.
Each statistic, shown in numeric form, is accompanied by a bar which represents where the team ranks among all 31 teams. A longer, darker bar represents a high (better) rank. A short, lighter color bar represents a low (poor) rank.
I will use this tool often during the course of the season to assess the Bruins against other NHL teams.
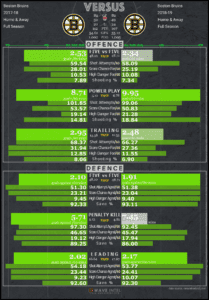
A quick look at VERSUS’s ranking bars and we may come to the conclusion last year’s Bruins were not as good as the previous season’s version. It was true in the points column as well as the underlying number. But perspective is needed here – we are talking about two great regular seasons.
Room for Improvement
Last season, the two key statistics that fell below the NHL average were the five-versus-five offense at 2.34 goals per 60 mins, and the penalty kill leaking goals at a rate of 7.45 goals per 60 mins rate.
A closer look at the five-versus-five offense shows that the underlying numbers – the scoring chances and high danger chances – were also well below the NHL average. This may also account for the low shooting percentage (7.34); just not getting the grade-A chances to push the shooting percentage up and ultimately the goal rate.
The penalty kill, on the other hand, was a different story. The underlying shot and chance suppression numbers were good – in the mid to top rank of the NHL. The save percentage was below average and is the likely explanation of a sub-par penalty kill rate.
But! You should always question the numbers. There could be factors that put the numbers and results in context. The less-than-stellar five-versus-five offense could be, in part, due to the high numbers of games the Bruins control. When in control of a game (leading often), it’s possible players take fewer risks offensively and opt for peripheral chances a little more often, affecting their overall performance relative to the league.
On the penalty kill, the metrics for ‘scoring’ and ‘high danger’ chances don’t take into consideration the quality of the chances in relation to how the other team forces the goalie to move just before the chance arrives. Were teams scouting the Bruins PK last season and finding weaknesses? Were teams forcing Bruins goalies to move more resulting in better success for their chances? These are things the Bruins coaching staff will examine. The good news is, there is lots of room for improvement on the penalty kill.
Can The Bruins Sustain that Outrageously Good Power Play?
The good news is that the Bruins have been running an elite power play for a long time, and the players behind this lethal weapon don’t look to be slowing down anytime soon.
The bad news is that the underlying scoring chances rates are only good, not great. What’s great is the super high shooting percentage at 18.84. And I wonder if that is sustainable.
Is that high shooting percentage sustainable? Definitely possible. As I said in the previous section, all numbers should be questioned. There is a lot of sweat and tears behind these numbers. And although the scoring chance rates are not high, the power play is more about art and magic. We cannot fully take the numbers at face value. The Bruins may not need a high rate of ‘high danger’ chances to get power play results. A clear example of this is the power play of the Tampa Bay Lightning. It is the top power play in the NHL, yet they had one of the lowest ‘high danger’ chance rates in the league. Skill in players like Kucherov & Stamkos allows teams to generate and capitalize on scoring chances outside what is defined as the ‘high danger’ zone. Therefore the correlation between the ‘high danger’ scoring chance and scoring on the PP is not a fully reliable metric. In short, we cannot accurately assess the effectiveness of a power play solely on numbers alone.
The #NHLBruins were the 3rd best team in the #nhl against playoff teams.
😮 They ran the table against 9 teams.
🤔 #allcaps #gopens & #tblightning gave them trouble. @MurphysLaw74 @NHLBruins pic.twitter.com/5li54vzUUz— Jason Paul (@WaveIntel) September 10, 2019
When It Counts
The Bruins are a team that will rise to the occasion. Last season they were the 3rd best team in the NHL against playoff-bound teams. And, of course, we experience that amazing playoff run too. But before the Stanley Cup playoffs began, the Boston Bruins were gearing up. In their last 10 games of the season (right side of the image below), the team improved their five-versus-five offense and the penalty kill. The Bruins added more than 1.5 goals per 60 mins five-versus-five, and increased their penalty killing shot and chances suppression rates to be among the best in the NHL during the last 10 games of the season.
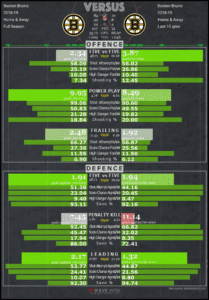
The final numbers tally? It all adds up to a lot of confidence going into this season.
During this season, I will keep a close eye on these numbers and report back to you in this space. Until then, based on recent performance, we should expect a lot of winning from the Bruins.

