
Analytics & Analysis
Outliers: Bruins’ Players Among NHL’s Best
The Boston Bruins are putting together yet another nice season. Through all the ups and downs, including the injuries and mini-slums, the Bruins find themselves well above the group of desperate teams trying to stay in the playoff race.
Of course, in the new age NHL defined by skill parity and exasperated by the loser point, the Bruins probably can’t afford to take the last half of the season off. But, barring devastating injuries (knock on wood), the Bruins have shown themselves to be worthy contenders; they are not a middle-of-the-pack team susceptible to the randomness of the game. In this article, we’ll take a look at some of the incredible numbers driving the winning ways of the Bruins.
It's January; the cream is starting to rise to the top.#stlblues #ALLCAPS #NHLBruins pic.twitter.com/byB35Ouk1d
— Jason Paul 🥥 (@WaveIntel) January 10, 2020
Goaltending Equilibrium
You could argue that Tuukka Rask is putting up the best five-on-five performance among all NHL goalies. But what the chart below illustrates is that the Bruins are putting him in a place to succeed, and that’s exactly what he is doing.
The Expected Goals Against (xGA) metric tries to measure the quality of the chances against by taking factors into account such as shot location, speed and angle of the pass and the type of shot. Rask’s five-on-five Expected Goals Against rate (per 60 mins) is 1.87, and his actual goals against average (GAA) is 1.73. Jaroslav Halak’s numbers are 2.14 xGA/60 and 2.26 GAA.
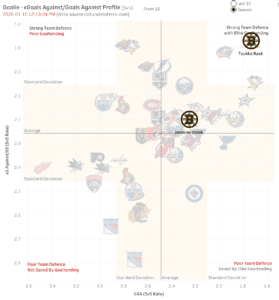
The fact that there is not a wide discrepancy between the expected and the actual goals against shows nice harmony between the efforts of the team and the goalies. By comparison, the Minnesota Wild have an excellent 1.89 five-on-five xGA/60 while Devan Dubnyk is in net, a similar number to the Bruins when Rask is in net. However, Dubnyk’s actual performance, 2.80 GAA, is well below The NHL average
With a strong team effort behind him, Rask is putting up some of the best 5v5 numbers in The NHL.
Torey Krug’s Possession and Goal Suppression Obsession
When it comes to combining offence and defence during five-on-five play, Torey Krug is in elite company. Only a handful of defensemen have a better Shot Attempts Share (Corsi percentage) than Krug’s 55.48% and also combine high-end goal suppression (defined by Expected Goals Against rate).
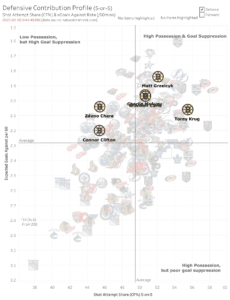
Krug has a 2.06 five-on-five xGA/60 which, although is lower than most of the other Bruins defensemen, is well above average in the NHL. There is a cost for offensive production, but it seems that Krug is finding that balance nicely at this point in his career.
News Flash: David Pastrnak is a Lethal Scoring Machine
Unless you have been living under a rock, you know that David Pastrnak has arrived in a big way. With all the talent in the NHL these days, it amazes me just how impressive his production is compared to his NHL peers. The graphic below shows the extent of the separation between Pastrnak and the rest of the NHL. At a per 60 minute rate, no player comes close to combining both power play and five-on-five goal scoring power as Pastrnak.
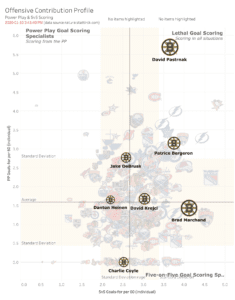
At 5.69 power play goals per 60 minutes, no player can match Pastrnak’s power play prowess. By comparison, Connor McDavid’s rate is 2.89 and Austin Matthews’ 3.46.
What’s even more impressive is Pastrnak’s five-on-five production, scoring well above the standard deviation of the league at 3.65 goals per 60 minutes. Again, that’s better than McDavid and Matthews. In fact there are only a handful of players who can boast a significantly higher five-on-five goal scoring rate than Pastrnak.
Brad Marchand’s Power Kill Skill
It’s clear that Brad Marchand is a special player. He is a key contributor in all situations of the game, and the penalty kill is no exception. As the numbers shake out, Marchand is not only the best Bruins penalty killing forward, he is one of the best in the entire NHL.
Only a handful of forwards have a slightly better Expected Goals Against rate than Marchand. He is in a special group of penalty killing forwards, including Pavel Zacha, Ilya Mikheyev, Nic Dowd and Kevin Rooney. They have the highest levels of expected goal suppression and offensive threat to generate chances for short handed goals.
Penalty killing forwards: #NHLBruins relative to the NHL.
relatively even TOI/g distribution between the Bruins forwards (all under 2mins/g). Brad Marchand, always seems to be on top of every 'list' i make.
[min 1.5 PK TOI/g] pic.twitter.com/DYrSCNue0z
— Jason Paul 🥥 (@WaveIntel) January 9, 2020
Of course, how a player is deployed can affect these statistics; facing the first or second power play unit consistently can affect these numbers, so it’s always good to consider context when interpreting these statistics. In the case of the Bruins, the penalty killing minutes are fairly evenly distributed between the forwards. Marchand’s performance is exceptional.
Skill Prevails
The Bruins’ strong performance is being led by their skilled and established players. Barring injuries, there is no reason to see a regression in team performance during the second half of the season. But it would not surprise me to see Don Sweeney dip into the trade market to bolster the secondary scoring on the team.
All data visuals by www.waveintel.org.


Bruins Daily: ESPN Doubts Bruins; Lohrei; Bennett

Bruins Left Marveling Over Breakout Game For Lohrei

Bruins Daily: Swayman Rolls On; Proud Daddy Carlo Scores

Bruins Postgame: Swayman Clutch Again, Bruins Win 5-1

Brandon Carlo Scores For Crew Carlo In Game 1

Murphy: Montgomery Should Take More Bullets For His Players

Speculation On Jim Montgomery’s Future Building

Montgomery Calls Out Pastrnak After Game 6 Loss

Game 6 Injury, Lineup Updates For Bruins And Maple Leafs
