
Analytics & Analysis
Outliers: Bruins By The Numbers

The shine has come off the Boston Bruins a little bit in the last couple weeks, however all the points they’ve banked so far have given them a good buffer; some breathing room to allow for no panic while they work out the kinks. So let’s take a look at the key performance areas of the team as well as some individual players.
Offensive Attack Remains Hot; Defense Suffering
First, although the Bruins have stumbled in the last 10 games, they still managed to bank 13-points in the standings. A closer look at the underlying numbers shows that the offensive performance is still strong both at five-on-five and on the power play.
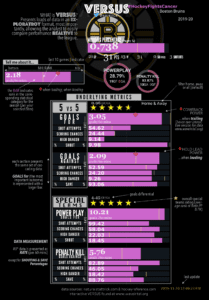
The defensive numbers are also good, but during the last 10-games, both the five-on-five and penalty kill have performed closer to the NHL average, as indicated by the little yellow indicators in the graphic above.
We Know Who’s Scoring On The Power Play; What About Five-on-Five?
Well, the short answer is: It’s the Perfection Line, of course. But we can get a better idea of which players are producing good chances by using expected goals, an advance statistic that takes into account many factors including shot quality.
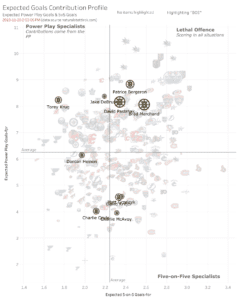
The graphic above shows which players expected goals contribution is on the power play, five-on-five, or both. The top right quadrant with label Lethal Offence is self explanatory; these players produce on both the power play and five-on-five. Because of the elite talent of the Perfection Line, they actually score well above their expected rate. So this graphic is more useful at looking at where the other Bruins’ players land. Of course, several players do not get any power play time so they do not appear on this chart. In this chart, Torey Krug stands out as a player who can improve his five-on-five contribution.
For an overall look at performance, let’s look at five-on-five expected goals for and against in the next section.
Expected Five-on-Five Performance At Both Ends Of The Ice
I mentioned at the top, that the overall five-on-five performance of the Bruins is very good, however this performance can be masked by a high shooting percentage or save percentage. The expected goals advanced statistic can remove some of these factors and allow us to isolate a player’s performance. Below is a graph that shows expected goals against and expected goals for. The quadrant labels help show that the best performers are in the top right quadrant named Great Offence & Defence.
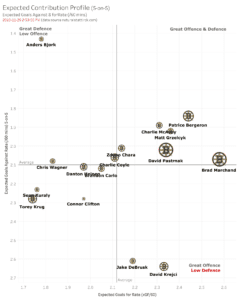
This chart is isolating the Bruins players only; not compared to the rest of The NHL. But I think it gives a good indication of which players are performing relative to the team. Jake DeBrusk and David Krejci both stand out as players giving up too many chances, however they are providing good offence. Torey Krug, again, stands out as a player performing well below the team’s average at five-on-five.
Matt Grzelcyk and Carlie McAvoy showing very strong numbers at five-on-five. And, I would be repeating myself if mention that Brand Marchand, David Pastrnak and Patrice Bergeron are, well, elite. It’s a good indication that these statistics don’t lie.
Of course, there are many other factors to consider when looking at these results, such as challenging deployments (including defensive zone starts), teammates, injuries and the like. Regardless, this gives some good insight into where to look for improvements.
All statistics used in this article are from naturalstattrick.com and hockey-reference.com. All graphs courtesy waveintel.org.


Ullmark ‘Not Being A Salty Crybaby’ As Swayman Rolls On

Murphy: Leafs Falling Off The Composure Tree

Bruins Daily: Closing Issues; Leafs In Denial; Makar Next Orr?

Colageo: Marchand-era Boston Bruins Look to Advance

Bruins Daily: Marchand Clinic; Lightning, Islanders Avoid Sweeps

Bruins Daily: Marchand Delivers; Keefe Whines; Quinn Fired

Swayman Admits True Feelings On Goalie Rotation

Bruins Lose Defenseman; Recall Another

Keefe Claims Marchand Gets Special Treatment From Refs
