
Analytics & Analysis
Bruce Cassidy’s Tenure Defined by Defense; Backed by Rask

Since Bruce Cassidy’s first full season as head coach with the Boston Bruins starting in the 2017-18 season only the Tampa Bay Lightning have a better regular season points percentage. The Bruins rank second in The NHL in power play percentage (the Lightning are first) and they rank second in goals against per game (behind the Dallas Stars).
It is quite remarkable that Cassidy and his coaching staff have been able to maintain the strong defensive numbers while integrating younger players in the line up and producing standout offensive performances. It’s what has separated the Bruins from the pack of teams with similar or arguably better offensive power such as the Edmonton Oilers. Defense first, as they say.
Funny stuff from Boston's Bruce Cassidy when I asked him about job security in the NHL coaching ranks:
"Laviolette, DeBoer, Gerard, all Cup finalists that didn't win in the last few years. So I started thinking, well who lost in the Stanley Cup Final last year? That guy's next."
— Dan Rosen (@drosennhl) January 24, 2020
But, I’m never one to just give credit without taking a deeper look at the data. When the defensive numbers are so good, the first place to look to measure impact is the goalie. How much influence has Tuukka Rask had on the outcomes of the Bruins’ results? In the game of hockey, we can never completely untangle the impact of the coach’s system and players to give definitive credit, but we can try our best.
What’s Behind the Bruins’ Strong Defense?
I collected all the data from the start of the 2017-18 season to today. I made a bunch of lists, ranking all NHL goalies with a minimum of 60-games played. Rask was consistently at or near the top of most of these lists. But what was interesting was that much of the data gives credit to the Bruins’ team defense which is, in part, a product if Cassidy’s system and player deployment.
Fascinating stats thread that eventually lands on Pekka. https://t.co/KATjpxMxSw
— Braden Gall (@BradenGall) January 24, 2020
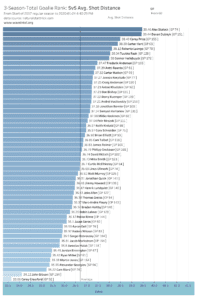
Here are some of the interesting stats that may demonstrate the power of the Bruin’s team defensive system in helping Rask achieve top results. The average shot distance (in feet) that Rask faced during five-on-five play is 38.04, which puts him at sixth among all goalies. Near the bottom is John Gibson who’s average shot is almost four feet closer at 34.12.
Cassidy’s Effective Defensive System
The statistic that I believe is most telling is Expected Goals Against, which attempts to add more accuracy to measuring the quality of shots against. It includes variables like shot location, but the models also recognize events like rebounds and rush chances. It assigns a value to each shot based on the likelihood of the shot resulting in a goal.
In the graph below you can see that Rask is tied for the lowest Expected Goals Against per 60-minutes with Devan Dubnyk at 1.93. That’s 0.37 Expect Goals Against less than The NHL average and 0.68 less than John Gibson with the second-highest rate of 2.61 Expect Goals Against per 60-minutes.
Rask and Bruins Team Defense The NHL’s Best Combo
It’s clear, based on the numbers we just reviewed, that the Bruins’ team defensive system is very strong, if not the strongest in The NHL since Cassidy’s first full season as head coach. But how much value is Rask adding to the equation? To answer this question, I plotted all goalies (with a minimum of 60-games played) on quadrant chart with Expected Goals Against per 60-minutes and actual Goals Against per 60-minutes. The idea is to see visually how all the goalies compare relative to each other.
It’s easy to see, with the labeled quadrants, that Rask’s performance over the past three seasons is among the best in the league. The higher along the Y-axis (Expected Goals Against) the better team defensive support; along the X-axis (actual Goals Against Average) to the right side, illustrates better goalie performance. But the important takeaway here is the relationship between the two metrics relative to all other goalies. This is where you can explore whether there is disparity in the performances between the goalie and his team’s defensive support.
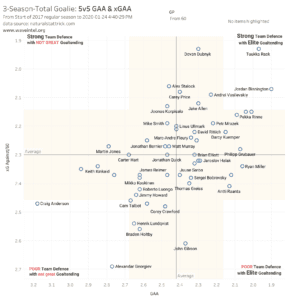
Rask has an ideal comparison; Minnesota Wild’s Devan Dubnyk gets the same team support as Rask with an Expected Goals Against of 1.93, but his actual Goals Against (2.30) is closer to The NHL’s average. Rask’s actual Goals Against is 1.97; that’s 0.33 goals per 60-minutes less than Dubnyk.
There’s one goalie, Jordan Binnington, who has a better actual Goals Against Average than Rask over this period. He also gets strong defensive support, but not quite as much as Rask. With only 67-games played, Binnington also has a much smaller sample size than Rask who has played in 128-games over this three season sample.
There is also a group of goalies, including Pekka Rinne and Ben Bishop, that cannot quite match Rask’s excellent Goals Against Average but they arguably deserve more accolades than Rask because their respective teams have not provided the same level of defensive support as the Bruins have.
There are many goalies that have a nice equilibrium with their team’s defensive performance. But no team-goalie tandem can match the performance the Bruins and Rask have delivered over the past three seasons. It’s a perfect cooperation between Cassidy’s system, player buy-in and execution, and Rask’s performance.
All graphs courtesy www.waveintel.org, with statistics from www.naturalstattrick.com.


Bruins Daily: Goalie Contoversy; Ruff Redux; Playoffs

Murphy: Montgomery Made The Right Call With Ullmark

Bruins Postgame: Matthews, Leafs Beat Bruins 3-2

Bruins Recall Forbort; Brazeau Update

Bruins vs Maple Leafs Game 2: Preview; Betting Odds And Picks
Boston Bruins Make Series Of Transactions

Can Unsung Hero On Bruins Defense Shut Down Matthews?

Bruins Make Two Recalls; Hoping For Injured Players

Colageo: Bruins, Maroon Keep Plan for Maple Leafs
