
Boston Bruins
Bruins Numbers: Old Bear, New Tricks?

We’ve reached the eight game mark with enough sample size to take a look at the Boston Bruin’s data footprint. Let’s see how the Bruins are performing, numbers-wise. Sometimes the numbers can help identify holes in the team’s game, or identify an adjustment in their system. And, for hockey-mad people like me, it’s always fun to see if the numbers align with the ‘eye test’.
The VERSUS Comparison Tool (below) provides a comprehensive look at the team’s performance. The blue bar indicates league rank; the longer the bar, the better the team is performing in that category compared to all other NHL teams. The data at the beginning of the bar is the raw data for the category.
On the left side is the performance of the Boston Bruins last season, 2018-19. On the right side is the performance for this year so far.
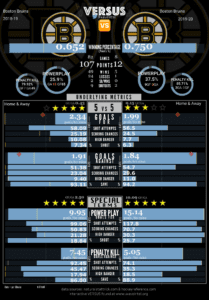
Special Teams are Very, Very Special
The Bruins had excellent special teams last season driven by an outstanding power play (we won’t mention all the shorthanded goals scored against in this article). The Bruins have been able to better those numbers on both the power play, scoring at a 15.14 goals per 60 mins rate, and the penalty kill, improving to allowing only 5.05 goals per 60 mins rate.
On the power play, the Bruins create 70.7 scoring chances per 60 mins, only the Edmonton Oilers generate more chances. However, as reported previously, the Bruins power play is extremely aggressive, but also gives up 18.5 scoring chances against per 60 mins while on the power play; most in the league. Last year, they allowed 15 short handed goals against; the highest in the NHL. This year, they have allow zero. You can expect that number to change.
Is there any ‘hot air’ in these numbers? Usually we can measure ‘hot air’ by comparing the scoring chance rates with the shooting percentage – in the case of the power play -, and the save percentage – in the case of the penalty kill. If the scoring rates are low, and the shooting percentage is high, it’s possible to expect a decrease in production (goals). In the case of the Bruins special teams, all the blue bars are long (meaning high ranking; good), which indicates good equilibrium; no hot air.
But this is not the case when we look at the five vs five numbers.
Bruins Need to Improve Five vs Five
When we look at the five vs five numbers, the patterns look similar to last year, with low ranking goals-for rate, and a stellar high ranking goals-against rate. The only difference this season is there seems to be some hot air in the defensive numbers. The goals-against rate is outstanding at 1.84 goals against per 60 mins, however the scoring chance suppression rate is poor. The Bruins allow 29.6 scoring chances per 60 min, which is near the bottom of the NHL. Goaltending, as you can see with the 94.2 five vs five save percentage, is the core reason for the defensive success.
The Bruins will need to improve on their defensive game if they want to continue to keep goals against down.
Does this analysis align with what you have been seeing on the ice? Please comment or get in touch on twitter with your thoughts.


Murphy: Is Montgomery Nervous About Another First Round Exit?

Bruins Daily: Bring On The Leafs! East Playoffs Bracket Set

Bruins And Leafs Will Renew Playoff Rivalry

Trent Frederic Wins NESN 7th Player Award

Legendary Bruins Announcer Jack Edwards Retiring

Could Bruins Sign A Sure-Shot Hall Of Famer This Summer?

Bruins Daily: Kane To Bruins? Hanifin Contract; Frozen Four

Murphy: Are Sweeney And Montgomery Safe?
Bruins Reassign Defenseman To Providence (AHL)
