
Analytics & Analysis
Bruins Numbers: Power Play Mystery

It’s much too early to derive any conclusions from the underlying statistics only two games into the season. The most important statistic so far are the two wins in the standings for the Boston Bruins.
The team is currently two-games deep into a four-game road trip to start the season, which has prompted a closer look at the performance of the Bruins at home compared to the road.
#nhlbruins start the season on the road.
🧐 Compared to playing at home (right side), the Bruins special teams performance drops significantly. The PP proficiency goes from top of the league to middle-of-the-pack. @MurphysLaw74 #nhlanalysis pic.twitter.com/HQqoCP71L7
— Jason Paul (@WaveIntel) October 5, 2019
Home ‘advantage’ is not what it once was. There was a time when a building’s unique features favored the home team; when player/line matchups would garner greater results. But times have changed. The building and ice surfaces are all the same. The skill level is so high across the full lineup that coaching efforts for matchups are less fruitful.
Nevertheless, team results vary at home and on the road. What are the unique performance differences for the Bruins?
We can do a quick analysis using the VERSUS Team Comparison Tool (WaveIntel.org) by comparing the Bruins performance on the road (left side of the graphic) to home (right side).
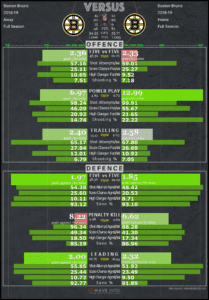
First, the end result. The Bruins had 29 wins at home and 20 on the road, so there must be a difference in play, right? Looking more closely at the underlying numbers, the areas that stand out the most are the special teams.
THE POWER PLAY
On the road, the power play (scoring at a 6.97 per 60 mins rate) is almost half as effective compared at home (scoring at a 12.99 per 60 mins rate). It was the best home power play in the NHL last season by a wide margin. The next best home power play was the product of the Winnipeg Jets scoring at a rate of 11.56 goals per 60 mins. The Jets and Bruins were the only two NHL teams to score power play goals at a double-digit rate at home.
When it comes to the power play, there’s no real matchup disadvantage on the road. And when you look at the scoring chances-for, it illustrates that the Bruins were executing similarly on the road and at home. The only significant statistical difference between the road and home power play was the shooting percentage; at home, it was an astronomically high 22.22% compared to a respectable 14.74%. Normally a drop like this coincides with a drop in the rate of quality scoring chances, but that is not the case with the Bruins.
It’s worth noting that other teams with quality power plays also suffered a significant drop in power play production on the road including the Jets drop from 19.59% (shooting percentage) to 12.70% on the road (but could be the result of a sizeable drop in high-danger-chances for), and the Flames dropping from 15.85% to 11.48%, but also could be the result of a drop in chances for.
But other teams with strong power plays were able to maintain similar production on both the road and home, including the Tampa Bay Lightning, the Edmonton Oilers and the Colorado Avalanche.
The Bruins Power Play Shooting Percentage Mystery?
Unfortunately (or fortunately) the data is not sophisticated enough to provide a definitive answer, but we can do more digging. Let’s take a look at the power play units.
Below is a chart I put together with data from naturalstattrick.com. Each section ‘home’ and ‘away’ shows the Bruins first power play unit with Pastrnak, Marchand and Bergeron getting the bulk of the ice time (3.16 mins per game at home and 2.90 mins per game on the road).
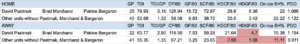
You can see that all the chances-for sag a little bit on the road, with a drop in CF (shot attempts for), SCF (scoring chances for) and HDCF (high danger chances for). But the big underlying stat that stands out for me is the conversion rate of the HDCF. The line is converting at almost half the rate, from 8.36 high-danger goals-for per 60 mins at home to 4.7 on the road. But overall, they are still producing at a very high level.
That leaves us with the second wave of power play. They see significant drops in producing high-danger-chances; producing a very high 20.5 HDCF rate at home compared to only 7.59 on the road. From there the results cascade to producing only 1.08 high-danger-goals per 60 mins, and an overall shooting percentage of 11.11 (compared to 22.22% at home). The second way of the power play is just not getting chances in the slot and in front of the net as they do at home.
Based on these numbers, it would seem that the second wave of power play units for the Bruins is the area to examine. And this is where more digging and some ‘eye tests’ will come in handy. There’s always an explanation for these numbers.
It’s these kinds of issues that keep coaches and hockey nerds up at night. Enjoy your hunt for plausible explanations.


Can Unsung Hero On Bruins Defense Shut Down Matthews?

Bruins Daily: East Game 1 Schedule Set; Farewell Coyotes

When Will Bruins-Leafs Game 1 Be?

Murphy: Is Montgomery Nervous About Another First Round Exit?

Bruins Daily: Bring On The Leafs! East Playoffs Bracket Set

Bruins Daily: Kane To Bruins? Hanifin Contract; Frozen Four

Murphy: Are Sweeney And Montgomery Safe?
Bruins Reassign Defenseman To Providence (AHL)

Bruins GM Don Sweeney Hired For Prestigious Positions
